A number of papers (on agricultural productivity, conflict, food security, and impacts of climate change, for example) use cropland cover data as controls. How good are these data?
Here’s the abstract of a paper (open access) from Wei and co-authors:
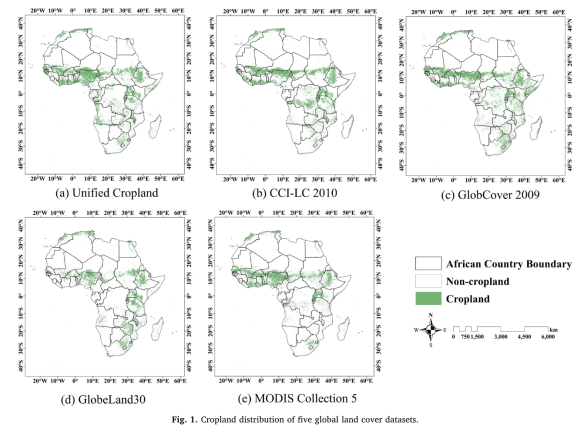
Accurate geo-information of cropland is critical for food security strategy development and grain production management, especially in Africa continent where most countries are food-insecure. Over the past decades, a series of African cropland maps have been derived from remotely-sensed data, existing comparison studies have shown that inconsistencies with statistics and discrepancies among these products are considerable. Yet, there is a knowledge gap about the factors that influence their consistency. The aim of this study is thus to estimate the consistency of five widely-used cropland datasets (MODIS Collection 5, GlobCover 2009, GlobeLand30, CCI-LC2010, and Unified Cropland Layer) in Africa, and to explore the effects of several limiting factors (landscape fragmentation, climate and agricultural management) on spatial consistency.
The results show that total crop-land area for Africa derived from GlobeLand30 has the best fitness with FAO statistics, followed by MODISCollection 5. GlobCover 2009, CCI-LC 2010, and Unified Cropland Layer have poor performances as indicated by larger deviations from statistics. In terms of spatial consistency, disagreement is about 37.9 % at continental scale, and the disparate proportion even exceeds 50 % in approximately 1/3 of the countries at national scale.We further found that there is a strong and significant correlation between spatial agreement and cropland fragmentation, suggesting that regions with higher landscape fragmentation generally have larger disparities. It is also noticed that places with better consistency are mainly distributed in regions with favorable natural environments and sufficient agricultural management such as well-developed irrigated technology. Proportions of complete agreement are thus located in favorable climate zones including Hot-summer Mediterranean climate(Csa), Subtropical highland climate (Cwb), and Temperate Mediterranean climate (Csb). The level of complete agreement keeps rising as the proportion of irrigated cropland increases. Spatial agreement among these datasets has the most significant relationship with cropland fragmentation, and a relatively small association with irrigation area, followed by climate conditions. These results can provide some insights into understanding how different factors influence the consistency of cropland datasets, and making an appropriate selection when using these datasets in different regions. We suggest that future cropland mapping activities should put more effort in those regions with significant disagreement in Sub-Saharan Africa.
Here’s what they did:
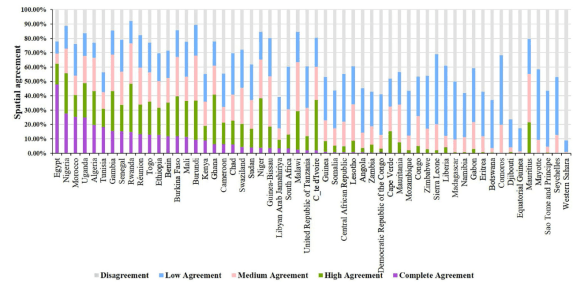
…. we compared the spatial agreement of cropland to assess the consistency of five datasets in the same location. These datasets were overlapped to generate a new composite map revealing whether and where the original datasets agreed on the same locations (Yang et al., 2017). Pixels of the composite map were assigned values ranging from 0 to 5. The highest value 5 represents the complete agreement, where all five datasets were consistent in cropland identification for a pixel. As the value decreases, spatial consistency between these crop-land datasets decreases. The lowest value with value 1 means that only one dataset identifies the pixel as cropland.
The best consistency of five datasets occurs in Egypt, with the complete agreement value of 47.86 %, while the highest disagreement is in Western Sahara, whose spatial disagreement is 91.08 %.
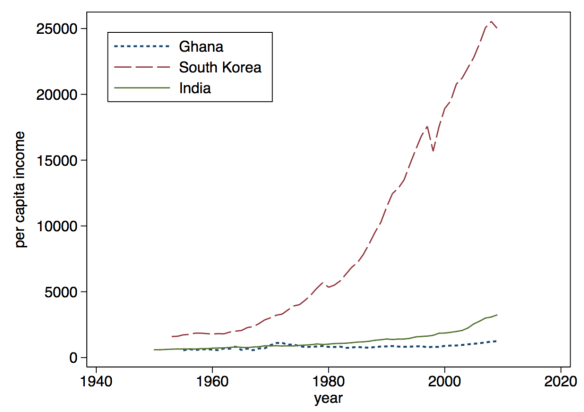
 To explain variation within SSA in poverty reduction, we consider aspects of colonial experience associated with the emergence of differing potential for redistributive policies to emerge after independence. Following the approach of Myint (1976) and others, we classify SSA countries into two groups according to the economic strategies used by the colonial authorities, using pre-independence data on factors such as inequality, land ownership by Europeans and political participation by Africans (the process is detailed in Appendix A, with validation by cluster analysis). In smallholder production economies, African agricultural smallholders had economic and some political participation. In contrast, extractive production economies dominated by foreign-owned mines and large-scale farms fostered the emergence of an elite politics characterised by urban bias and capital-intensive production technologies. During the colonial period African economies became clustered around a bimodal structure, which provided better opportunities to the poor in countries whose production was based on the development of labour-intensive smallholder exports than in countries whose growth strategy was based more on capital-intensive mines and large farms. We then test if the growth elasticity of poverty differs between these two groups of countries, using available (PovcalNet) poverty data since 1985, noting that mean growth rates for the two groups were very similar. The analysis shows that the smallholder group significantly outperformed the extractive group, smallholder experience is a significant predictor of poverty reduction, and inclusion of other potential explanatory variables does not alter the conclusion.
 Are local elites in the modal African country this powerful? Is this the sense one gets traveling in rural Ghana or Zambia? Do these (mostly) guys look like they are in charge? As the paragraph notes, “traditional leaders” often lack the means to coerce their constituents (the state is largely absent).
  Countries in sub-Saharan Africa accumulated external debt at a faster pace than low- and middle- income countries in other regions in 2017: the combined external debt stock rose 15.5 percent from the previous year to $535 billion. Much of this increase was driven by a sharp rise in borrowing by two of the region’s largest economies, Nigeria and South Africa, where the external debt stock rose 29 percent and 21 percent respectively.
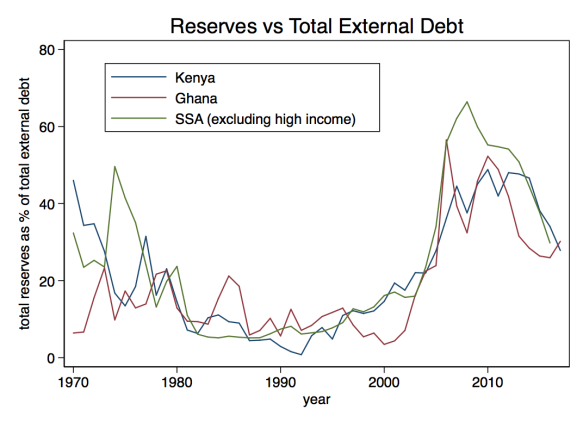


 Take the example of security assistance. If you want to reduce corruption in military procurement, I would suggest that you channel all assistance through the normal appropriation processes in African legislatures. More people will know how much money is going where, thereby increasing the likelihood of greater accountability. The same applies for budget support. Strengthen existing constitutional appropriation processes so that bigger constituencies get to own the aid dollars.
 Sources close to Rosário Fernandes, ex-head of the revenue authority, the Autoridade Tributária de Moçambique, have told us of systematic diversions of taxes straight into the pockets of the Frelimo elite, especially in the later years of President Guebuza’s term of office, when he exercised enormous patronage. Massively inflated contracts were commonplace. The latest to emerge is the extravagant, nearly complete, Bank of Mozambique building in Maputo, which boasts a helicopter landing pad on the roof. Originally estimated to cost $90 mn., the final cost is reckoned at at least $300 mn., with kickbacks and ‘commissions’ accounting for the cost inflation, say Frelimo sources.