How Good Are Datasets on Cropland in African States?

A number of papers (on agricultural productivity, conflict, food security, and impacts of climate change, for example) use cropland cover data as controls. How good are these data?

Here’s the abstract of a paper (open access) from Wei and co-authors:

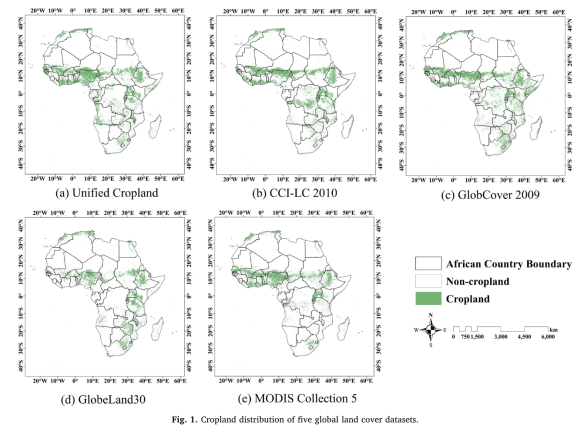
Accurate geo-information of cropland is critical for food security strategy development and grain production management, especially in Africa continent where most countries are food-insecure. Over the past decades, a series of African cropland maps have been derived from remotely-sensed data, existing comparison studies have shown that inconsistencies with statistics and discrepancies among these products are considerable. Yet, there is a knowledge gap about the factors that influence their consistency. The aim of this study is thus to estimate the consistency of five widely-used cropland datasets (MODIS Collection 5, GlobCover 2009, GlobeLand30, CCI-LC2010, and Unified Cropland Layer) in Africa, and to explore the effects of several limiting factors (landscape fragmentation, climate and agricultural management) on spatial consistency.cropland

The results show that total crop-land area for Africa derived from GlobeLand30 has the best fitness with FAO statistics, followed by MODISCollection 5. GlobCover 2009, CCI-LC 2010, and Unified Cropland Layer have poor performances as indicated by larger deviations from statistics. In terms of spatial consistency, disagreement is about 37.9 % at continental scale, and the disparate proportion even exceeds 50 % in approximately 1/3 of the countries at national scale.We further found that there is a strong and significant correlation between spatial agreement and cropland fragmentation, suggesting that regions with higher landscape fragmentation generally have larger disparities. It is also noticed that places with better consistency are mainly distributed in regions with favorable natural environments and sufficient agricultural management such as well-developed irrigated technology. Proportions of complete agreement are thus located in favorable climate zones including Hot-summer Mediterranean climate(Csa), Subtropical highland climate (Cwb), and Temperate Mediterranean climate (Csb). The level of complete agreement keeps rising as the proportion of irrigated cropland increases. Spatial agreement among these datasets has the most significant relationship with cropland fragmentation, and a relatively small association with irrigation area, followed by climate conditions. These results can provide some insights into understanding how different factors influence the consistency of cropland datasets, and making an appropriate selection when using these datasets in different regions. We suggest that future cropland mapping activities should put more effort in those regions with significant disagreement in Sub-Saharan Africa.

Here’s what they did:

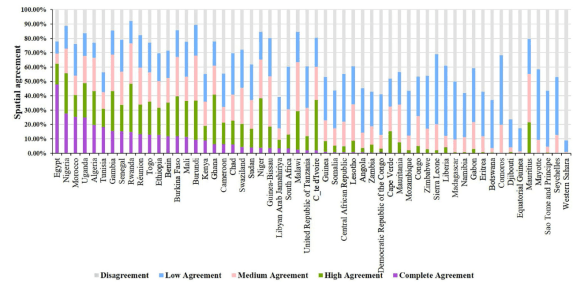
…. we compared the spatial agreement of cropland to assess the consistency of five datasets in the same location. These datasets were overlapped to generate a new composite map revealing whether and where the original datasets agreed on the same locations (Yang et al., 2017). Pixels of the composite map were assigned values ranging from 0 to 5. The highest value 5 represents the complete agreement, where all five datasets were consistent in cropland identification for a pixel. As the value decreases, spatial consistency between these crop-land datasets decreases. The lowest value with value 1 means that only one dataset identifies the pixel as cropland.cropland_cover

The best consistency of five datasets occurs in Egypt, with the complete agreement value of 47.86 %, while the highest disagreement is in Western Sahara, whose spatial disagreement is 91.08 %.

The U.S. tops list of FDI projects in Africa

This is from EY’s 2018 Africa Attractiveness report:

Screen Shot 2018-10-30 at 5.27.43 PM
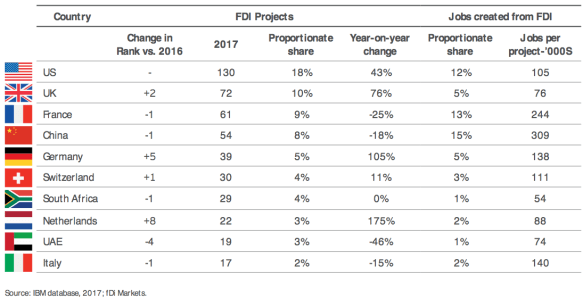
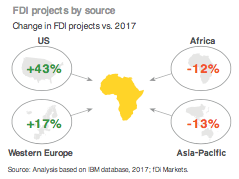
Mature market investors continue building on their deep-seated ties to Africa. In 2017, the US remained the largest investor in the continent, with a noticeable 43% growth in FDI projects. Western Europe, another well-established investor, also built on its already strong investments into Africa, up by 17%. However, emerging-market investments fell, with both intra-regional and Asia-Pacific investment declining by 12% and 13%, respectively. This is, in part, attributable to slower emerging markets growth and weak commodity prices.

It is odd that this report does not give the dollar values of FDI projects. But it has a summary of the distribution of projects and the number of jobs created. This is an important indicator because it reveals projects’ real impact on the real economy — as opposed to projects designed to create enclave economies. Notice that China is far and away the leader on this metric — with Chinese projects resulting in nearly three times as many jobs as American projects (FDI from Italy appears to be particularly good at producing actual jobs).

Screen Shot 2018-10-30 at 5.40.30 PM

Here’s another interesting observation on the sectoral focus on FDI projects from the report:

Over the past decade, we have discussed a shift from extractive to “consumer-facing” sectors, thanks to Africa’s growing consumer market. Mining and metals, along with coal, oil and gas, previously the major beneficiaries of FDI flows, have slowed, while consumer products and retail (CPR), financial services, and technology, media and telecommunications (TMT) have risen.

In 2017, FDI shifted somewhat, with consumer-facing sector investments slowing, in line with challenging operating conditions. The focus changed instead to manufacturing, infrastructure and power generation.

And finally, here are of “FDI-to-jobs” conversation rates. On this measure South Africa and Kenya stand out for their apparent inefficiency in converting FDI projects into jobs.

Screen Shot 2018-10-30 at 5.54.29 PM.pngMore on this here.


The top 20 best countries to invest your money in Africa

This is according to the latest Ernst & Young’s Africa Attractiveness Report (2016). Kenya is ranked 4th. Ahead of Tunisia, Mauritius, and Botswana. You just need to spend a few hours in Nairobi, or the other 46 county headquarters, to understand why. While economic inequality remains to be a huge (political) challenge, it’s hard to argue against the structural transformations underway in the Kenyan economy.

Screen Shot 2016-07-26 at 11.41.28 AM.png

Screen Shot 2016-07-26 at 11.36.26 AM

More on this year.

Some Africanist inside baseball

Image

Screen Shot 2015-12-01 at 8.58.24 PM

Africa’s Billionaires in 2014

Only 9 out of 54 African countries are represented on the 2014 Forbes billionaires list. There are certainly more than 29 dollar billionaires on the Continent (most of the rest being in politics). Let’s consider this list as representative of countries in which (for whatever reason) it is politically safe to be publicly super wealthy – which in and of itself says a lot about how far Nigeria has come.

Screen Shot 2015-03-03 at 12.24.39 PM

Source: Forbes

Some will look at the list and scream inequality. I look at the list and see the proliferation of centres of economic and political power. And a potential source of much-needed intra-elite accountability in African politics. For more on this read Leonardo Arriola’s excellent book on the role of private capital in African politics.

See also this FT story on the impact of currency movements on the wealth of Nigeria’s super rich. Forbes also has a great profile of Aliko Dangote, Africa’s richest man.

What is the optimal size of a global terror organization?

It looks like leaders of global terrorist organizations like al-Qaeda could benefit from lessons in organizational theory and on the theory of the firm. As William McCants argues in Foreign Affairs, it looks like al-Qaeda may have expanded too fast under its current leader Ayman al-Zawahiri, thereby resulting in the HQ’s loss of control over its subsidiaries, franchises and affiliates in the Middle East, Somalia and the Maghreb.  

As the political scientist Jacob Shapiro observes in his new book, The Terrorist’s Dilemma, all terrorist groups suffer from infighting for one basic reason. If they want to achieve their goals and to avoid being captured or killed, leaders of secretive violent organizations have to give their commanders in the field some measure of autonomy. When the field commanders become too independent, the leadership attempts to rein them in through various bureaucratic measures.

Without a doubt, Zawahiri is trying to rein in his unruly affiliates. What is striking is that Zawahiri created much of the problem himself by trying to expand al Qaeda too broadly. The one affiliate that Zawahiri did not push into a new arena of jihad, the Yemen-based al Qaeda in the Arabian Peninsula, has, unsurprisingly, avoided infighting. Zawahiri has now allegedly appointed AQAP’s leader, Nasser al-Wuhayshi, as al Qaeda’s ”general manager” and thus his eventual successor. Zawahiri had little choice but to promote from the ranks of AQAP, given the current disarray across the rest of al Qaeda.

But the organizational woes of al-Qaeda and affiliates should not give comfort to the global community. As McCants reminds us in his conclusion, dealing with a centralized terror group with an address (or quasi address) is better than trying to fend off lots of competing franchises [see here]: 

Zawahiri’s knack for creating factions and his unwillingness to part with them when they misbehave could help al Qaeda’s opponents blame the entire organization for the atrocities committed in its name. Over time, perhaps the bloody collage will dampen enthusiasm for joining al Qaeda and even horrify its members. But in the near term, Zawahiri’s poor management is not necessarily a boon to the United States and its allies. The various factions of a once-unified al Qaeda could compete with one another over which group can mount the biggest attack on the West. Whatever the case may be, Zawahiri’s inability to manage al Qaeda’s sprawling organization offers a preview of the infighting to come after his inevitable death.

Anyone know a good paper with a principal-agent analysis of terror organizations? 

How Africa Tweets

Click on image to enlarge.

Just out of curiosity I did a quick calculation of per capita tweets based on the figures from Portland Communications. The biggest difference between the two rankings is Gabon. My guess is that the rather slight variation in the right and left columns (especially for the top ten) is a reflection of the fact that about 57% of tweets geolocated in the region are from the ever ubiquitous cell phones.

Ghana’s ranking on either column was rather surprising.

Top 20 (by volume) Top 20 (per capita)
South Africa
Kenya
Nigeria
Egypt
Morocco
Algeria
Rwanda
Tunisia
Mali
Cameroon
Sudan
Angola
Namibia
Niger
Burkina Faso
Ethiopia
Libya
DR Congo
Gabon
Ghana
South Africa
Kenya
Morocco
Egypt
Nigeria
Rwanda
Tunisia
Namibia
Algeria
Mali
Cameroon
Gabon
Sudan
Angola
Niger
Libya
Burkina Faso
Ghana
Ethiopia
DR Congo

More on this hear.

HT Jason Stearns.