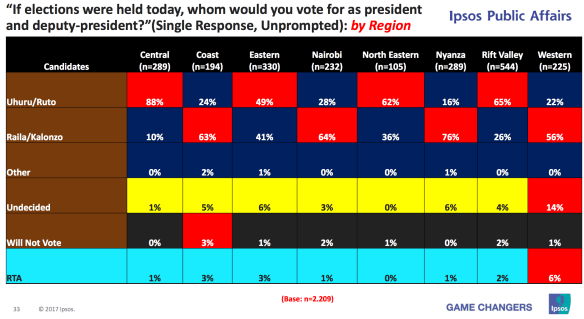
Below is a table from a previous post comparing the poll numbers and actual votes ahead of the 2013 presidential election, as well as May 2017 poll numbers for the two leading candidates (Messrs. Uhuru Kenyatta and Raila Odinga). You can read the background post here. See also here.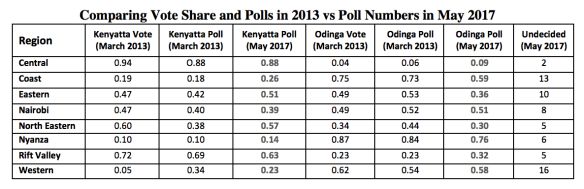 Also below is the July 23rd poll released by Ipsos Synovate that reveals some interesting changes over the last two months. As of now the race stands at 47% vs 43%, advantage Kenyatta. But with a margin of error of 2.09%, this is a statistical dead heat.
On President Kenyatta:
Kenyatta has seen his support decline in Nairobi (by 11 percentage points), Coast, Eastern, and Western regions. His support has increased in North Eastern (by 5 percentage points), Nyanza and Rift Valley regions. In addition, his support is stable in Central region at 88%.
On Prime Minister Odinga:
Odinga’s support has declined in Rift Valley (by 6 percentage points) and Western. His support has increased in Nairobi (by 13 percentage points), Eastern, Central, Coast, and North Eastern regions. In addition, his support is stable in Nyanza region at 76%.
Looking at Trends:
A bigger share of undecideds will likely break for Odinga: The above trends confirm my previous observation that undecideds in Coast, Eastern, and Western regions are likely to be reluctant Odinga supporters. Odinga has seen his poll numbers go up in Coast and Eastern as the number of undecideds has shrunk in both regions. At 14% in the latest poll, the number of undecideds in Western region remain virtually the same from the May figure (16% of respondents). Both Kenyatta and Odinga saw declines in their support in Western region between May and July, but most of the undecideds in the region will likely break for Odinga. Virtually all the leading political elites in the region support Odinga’s bid for the presidency.
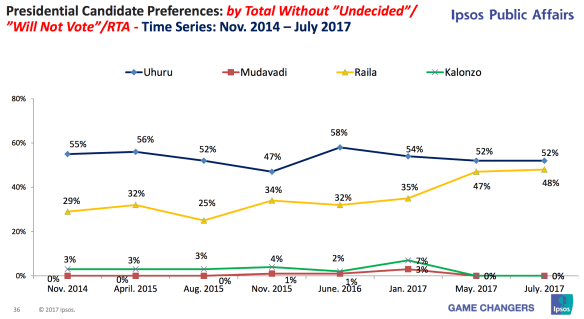
The race has tightened over the last two months: It is also clear that the race has tightened over the last two months as more voters have internalized the fact that this is a two-horse race between Kenyatta and Odinga. In particular, much of the tightening appears to have come from shifts in Western and lower Eastern, the two regions comprising the “Big Five” voting blocs where a clear majority of elites are behind the Odinga ticket.
What do the numbers say?
First a couple of caveats.
In the last cycle the polling by Ipsos was off by a few percentage points in either direction. The final polls before the election underestimated Kenyatta’s support in all regions except Western. The final poll also underestimated Odinga’s support in Coast, Nyanza, and Western regions, was spot on in the Rift Valley, and overestimated his support in the remaining four regions. This is largely because polling in Kenya is often structured by region, on account of the fact that vote choice often maps neatly on regional/ethnic cleavages. No polling firm has figured out a likely voter model (I honestly don’t know why). Much of the underestimation of Kenyatta’s support came from the erroneous assumption of evenly spread turnout across the country.
And speaking of turnout, it is important to note that the Uhuru/Ruto ticket has a structural advantage. On average, Kenyatta’s core support comes from wealthier regions of the country that are relatively easier to reach and mobilize. In addition, with nearly 40% of the electorate coming from just two of the “Big Five” voting blocs, the combined ticket also offers a classic minimum winning coalition which adds to efficiency of messaging and turnout mobilization. This is in contrast to the Odinga/Kalonzo ticket’s turnout challenge. Its core is three of the “Big Five” that combined add up to just over 30% of the electorate. Therefore, Odinga has to make the difference by appealing to smaller voting blocs, particularly in the Coast, North Eastern, and Rift Valley regions (especially among pastoralist subregions of the Rift). The pro-Odinga non-Big Five regions have historically had relatively lower turnout rates, in no small part because of lower rates of access to education and economic opportunities. Dispersed support also means dispersed messaging. It is not clear that Odinga has successfully been able to overcome his turnout challenge ahead of Tuesday’s election.
The numbers, taking into account likely turnout:
Based on 2013 turnout, I have created a model that takes into account county-level turnout (averaged at the constituency level to generate more data points). I have then clustered individual counties into regions. A more granular model that looks at individual voting blocs (e.g. that separates Nyamira and Kisii from the rest of Nyanza, Kitui, Makueni, and Machakos from the rest of Eastern, or Narok from the rest of the Rift Valley yields more or less similar results). Lastly, I weighted the estimated turnout in each county by the registration rates ahead of the 2017 elections. Turnout in 2013 varied from a low of 58% in Kilifi to a high of 95% in Makueni. Similarly, registration rates (as a share of eligible adults) ahead of 2017 varied from a low of 50.6% in Vihiga to a high of 86% in Kajiado. Presumably, these differences in registration rates reveal information on voter enthusiasm, and therefore likelihood of turning out next Tuesday.
All this is like attempting to perform open heart surgery with a blunt panga. So bear with me.
After the weighting, I then estimated turnout rates at the county level after which I used the raw vote numbers to estimate turnout rates at regional levels (polling is sparse at the county level). With the regional turnout figures, I then estimated the likely vote totals for Kenyatta and Odinga by region. Throughout this process I ignored the proportion of voters that are undecided.
In a model that gives less weight to registration rates (as proxies for voter enthusiasm and likely turnout), the estimated vote share is Kenyatta 52.8% vs Odinga 47.2%.
A more involved model that tries to estimate differential voter enthusiasm yields an even bigger advantage for Kenyatta (54% vs 46%).
In short, going by historical turnout rates, Kenyatta is still a strong favorite to win reelection next Tuesday.
Now, there are several ways in which I could be totally off the mark.
First, there is the issue of undecideds. The bulk of these voters are in Coast and Western regions, both Odinga strongholds. So far the trends indicate that undecideds appear to be breaking for Odinga in larger proportions. Should this trend continue, Odinga may eat enough into Kenyatta’s leads to force a runoff, or even an outright squeaker of a first round win.
Second, there is the issue of turnout. If Odinga were to average a turnout rate of 85 in Nairobi, Coast, and Western regions, my model estimates a vote distribution of 50.9% vs 49.1% in favor of Odinga. If Western and Coast regions alone got to 87% turnout, Odinga’s lead would increase to 51.1% vs Kenyatta’s 48.9%. Structurally, Kenyatta pretty much maxed out on turnout in 2013, while Odinga has a lot of head room.
As I keep saying, this is going to be very much a turnout election in which historical voting patterns strongly favor Kenyatta. For Odinga to have a fighting chance he has to convince undecideds to turn up and vote for him next Tuesday.
Other Interesting Polls to Consider:
There are two other polls that came out yesterday, one commissioned by Radio Africa and another done by Infotrak.
The Radio Africa poll puts the race at 47% for Kenyatta vs 46% for Odinga, a virtual tie. With this poll, too, the trends show a tightening race. Earlier in the month Kenyatta led Odinga by 49% vs 44%. The Infotrak poll puts the race at 49% for Odinga vs 48% for Kenyatta. Infotrak is the only polling company that has shown Odinga leading Kenyatta throughout this cycle.
Finally, Ipsos also released a poll yesterday that puts the race at 47% (Kenyatta) vs 44% (Odinga), but the details of which are not yet available. More on this soon.
 And here is an excerpt from one of the pieces:
 President Uhuru Kenyatta is yet to name his full second term cabinet,

 not always yield the desired results, and often comes with instability. Their vision of doing their best to build infrastructure and letting hardworking Kenyans do the rest makes sense if one believes that you go to battle with the army you have. Their proposed vision of Kenya is grounded in the idea that a rising tide, even if marked by high levels of inequality, lifts all boats. Simply stated, it is a vision that prizes ends rather than means.
 Which makes a lot of the campaigning in this cycle about building alliances and potential national coalitions for Ruto’s 2022 stab at the presidency. To this end three important narratives are emerging that specifically relate to Ruto’s quest to be Kenya’s 5th president.
 2. The number electoral units (wards or constituencies) had no influence on the rate of voter registration in the 47 counties. In other words, it is not the case that counties which had a lot more electoral units (and therefore potential candidates) experienced greater rates of voter mobilization for registration.
 3. However, the population per electoral unit (wards and constituencies) was negatively correlated with the registration rate. In other words, more populous wards and constituencies experienced lower registration rates relative to their less populous counterparts. This makes sense, to the extent that the IEBC was targeting a specific number of BVR kits per electoral unit per county.
 4. Bigger counties with relatively smaller populations benefited from the fact that land area was a consideration in IEBC’s allocation of BVR kits.


