Uhuru Kenyatta ahead of Raila Odinga in the first post-nomination poll

Ipsos just released a poll in which President Uhuru Kenyatta leads Hon. Raila Odinga 48-42% among a representative sample of voting age adults. While this is not a particularly good showing for an incumbent with a few achievements to tout, the poll confirms Kenyatta’s frontrunner status. Furthermore, a 6 percentage point lead combined with his structural advantage in the turnout game mean that if the polls do not narrow any further Kenyatta will likely win in the first round come August 8th. In 2013 most public polls consistently over-estimated Odinga’s support by about 2 percentage points by not accounting for turnout patterns.

A few things other things are worth noting from the Ipsos poll:

  1. Polls have tightened over the last few months. As Odinga consolidates the opposition, his poll numbers have converged on Kenyatta’s. This is a trend worth watching over the next few weeks.
  2. The number of undecideds, especially in Coast, Eastern and Western regions, is rather high. This should worry Odinga. Again, Kenyatta has a structural advantage in the turnout game, which means that if Odinga is to have a fighting chance he must ensure that his strongholds register both high turnout rates and give him an even bigger share of their votes than in 2013. That they remain undecided does not bode well for Odinga’s chances. In the table below, Kenyatta’s poll numbers are close to his numbers both in final poll of 2013 and the official election results. Undecideds appear to be voters who sided with Odinga in 2013.Screen Shot 2017-05-31 at 9.30.40 PM.png
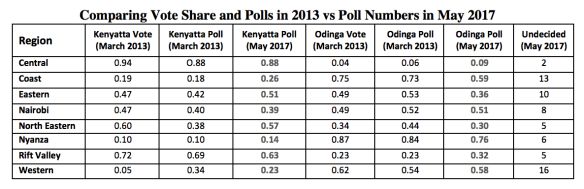
  3. This poll may be over-estimating Kenyatta’s support in Western region. In 2013 Kenyatta under-performed his poll numbers in Western region by a whole 29 percentage points. And so while his 23% rating in Western region may be a sign that Deputy President William Ruto’s investments are bearing fruit, I would not take these numbers to the bank just yet.
  4. Odinga has made significant gains in the Rift Valley region since 2013. One way for Odinga to force a runoff (or eke out a squeaker of a first round win) would be to peel off enough voters in from the North Rift. He appears to be doing that. His poll numbers in the region in 2013 were spot on, making his 32% rating in the region believable for now. Recent developments also suggest that he is gaining ground in Narok, Bomet, and parts of Kajiado. That should be a source of concern for the Kenyatta team.
  5. It is still a turnout game, and Odinga is trailing. The bulk of undecideds — in Coast, Eastern, and Western regions — appear to be likely Odinga supporters. While this may mean that they are likely to break for Odinga in August, it could also mean that they will remain undecided and stay home on election day. Hassan Joho, Kalonzo Musyoka/Charity Ngilu, and Musalia Mudavadi/Moses Wetangula have their work cut out for them.

While a lot may happen between now and August 8th, it is fair to say that Kenyatta is in a strong position. Odinga has several paths to victory, but success along any of those parts is dependent on the NASA coalition running a near-perfect campaign focused on both increasing turnout and running up the score in their strongholds. To this end the lack of enthusiasm in Coast, (lower) Eastern, and Western regions is definitely not a good sign.

The one thing that should worry Kenyatta is Odinga’s apparent gains in the Rift Valley region. If Odinga gains traction in Bomet, it is conceivable that he would also be able to peel off votes in Kericho. It is not that long ago that both Deputy President William Ruto had to camp in Kericho to avoid an embarrassing loss in a by-election. His preferred candidate ended up winning with 66% of the vote. In Bomet, incumbent Governor Isaac Ruto is backing Odinga. And while he will face a tough time swaying voters to Odinga’s camp, it is not far-fetched to imagine that he could bag around 40%. If the same happens in Kericho then two of the Rift Valley’s most important vote baskets will become swing. And Kenyatta would be in serious trouble.

Note: Nearly all the polls this cycle will not take into account any “likely voter models.” I will do my best to guestimate turnout rates based on passed voting patterns and other variables. 2026 out of 5484 contacted agreed to participated in this Ipsos poll.

On the Causes of Excess Female Mortality Across African States

This is from a new paper by Siwan Anderson and Debraj Ray:

In this paper, we explore how the phenomenon of missing females is distributed across Africa. We consider two age groups: zero to 14 years old, and 15 to 59 years old. With such high overall mortality rates in Africa, these two age groups comprise almost all of the excess female deaths on the continent. Overall, there are more than 1.7 million excess female deaths each year in Africa. Expressed as a fraction of the female population, the African numbers are significantly higher than their Chinese or Indian counterparts. Roughly 425,000 of these excess female deaths in Africa are in the younger age category (zero to 14 years old), while the remaining 1.3 million are in the older age category (15 to 59 years old). There is substantial regional variation in excess female mortality across the continent. In both age groupings, the largest numbers are in West Africa. In the younger age group there are almost 200,000 excess female deaths in a given year in that region, and more than 450,000 in the older age category. East Africa is next, with close to 100,000 excess female deaths at the younger ages each year, and almost 400,000 in the older age category. By comparison, North Africa has the lowest excess female mortality, with roughly 100,000 excess deaths each year across the two age categories. Although excess female mortality is extremely high in Southern Africa in the older age group, by contrast there is virtually no excess female mortality in this region for the younger age category. Likewise, relative to other regions, excess female mortality is lower in the younger age category compared with the older in East Africa.

Our methodology also allows us to explore which diseases are primarily responsible for this extreme excess female mortality across Africa. In the younger age category, almost all of these excess deaths are from infectious and parasitic diseases and respiratory infections. A primary cause of excess young female deaths is malaria, with roughly 110,000 excess female deaths from this cause alone each year. The secondary major cause is respiratory infections, with around 95,000 excess female deaths each year; then diarrhoeal diseases, with approximately 77,000 excess young female deaths each year. In the older age category, HIV is the primary killer. There are close to 800,000 excess female deaths from HIV each year across Africa, with the largest proportions found in Southern and East Africa. Maternal mortality is also a major cause, particularly in East and West Africa. There are close to 400,000 excess female deaths from this cause each year.

H/T Charles Kenny.

By the Numbers: A Look at the 2017 Presidential Election in Kenya

Kenya will hold a General Election on August 8th of this year. The national-level elections will include races for president, members of the National Assembly, and the Senate. County-level races will include those for governor (47) and members of County Assemblies (in 1450 wards).

This post kicks off the election season with a look at the presidential election. I also plan to blog about the more exciting gubernatorial races in the coming weeks.

Like in 2013, the contest will be a two-horse race between President Uhuru Kenyatta (with William Ruto as his running mate) and Hon. Raila Odinga (with Kalonzo Musyoka). The convergence on a de facto bipolar political system is a product of Kenya’s electoral law. The Constitution requires the winning presidential candidate to garner more than half of the votes cast and at least 25 percent of the votes in at least 24 counties. In 2013 Kenyatta edged out Odinga in a squeaker that was decided at the Supreme Court. Depending on how you look at it, Kenyatta crossed the constitutional threshold of 50 precent plus one required to avoid a runoff by a mere 8,632 votes (if you include spoilt ballots) or 63, 115 (if you only include valid votes cast). In affirming Kenyatta’s victory, the Supreme Court ruled in favor of the latter approach.

But despite the court’s ruling, a significant section of Kenyans still believe that Kenyatta rigged his way into office, and that Odinga should have won.

My own analysis suggests that it was a little bit more complicated. I am fairly confident that Kenyatta beat Odinga in the March 2013 election. But I do not think that he crossed the 50 percent plus one threshold required to avoid a runoff. At the same time, I am also confident that Kenyatta would have won a runoff against Odinga. All to say that I think the results in 2013 reflected the will of the people bothered to vote.

This year will be equally close, if not closer.

This is for the following reasons:

  1. Odinga has a bigger coalition: The third candidate in 2013, Musalia Mudavadi, is joining forces with Odinga this time round – as part of the National Super Alliance (NASA). Mudavadi managed to get just under 4% last time and will provide a much-needed boost to Odinga’s chances in Western Kenya and parts of the Rift Valley.
  2. Kenyatta has had a mixed record in office: The Kenyan economy has grown at more than 5% over the last four years. The same period saw massive investments in infrastructure — including a doubling of the share of the population connected to the grid and a brand new $4b railway line connecting Nairobi to the coast. However, these impressive achievements have been offset by incredible levels of corruption in government – with senior government officials caught literally carrying cash in sacks. Kenyatta is also stumbling towards August 8th plagued with bad headlines of layoffs and the ever-rising cost of living. Barely two months to the election, the country is in the middle of a food crisis occasioned by a failure to plan and a botched response that appears to have been designed to channel funds to cronies of well-connected officials.
  3. The Rift Valley: In 2013 much of the Rift Valley was a lock for Kenyatta (it is William Ruto’s political back yard). This time will be different. Parts of Ruto’s coalition in the Rift, particularly in Kericho and Bomet counties, may swing towards Odinga this year. All Odinga needs is about a third of the votes in these counties. I expect both campaigns to spend a lot of time trying to sway the small pockets of persuadable voters in these two counties.
  4. The Kenyatta Succession in 2022: In 2013 Kenyatta was elected as the head of an alliance, not a party. In 2017 he is running atop a party, the Jubilee Party (JP). It is common knowledge that JP is William Ruto’s project. Because he plans to succeed Kenyatta in 2022, he desperately needs credible commitment from Kenyatta and his allies that they will support his bid when the time comes. JP is an installment towards this goal, and is designed to allow Ruto to whip party members in line during Kenyatta’s second term (on a side note, Ruto needs to read up on the history of political parties in Kenya). But by forcing everyone into one boat, JP may actually end up suppressing turnout in key regions of the country, the last thing that Kenyatta needs in a close election.
  5. The ICC factor (or lack thereof): Because of their respective cases at the ICC, 2013 was a do or die for Kenyatta and Ruto (and their most fervent supporters). This time is different. Both politicians are no longer on trial at the ICC, and so cannot use their cases to rally voters. The lack of such a strong focal rallying point will be a test for Kenyatta’s turnout efforts.

Nearly all of the above factors sound like they favor Odinga. Yet Kenyatta is still the runaway favorite in this year’s election. And the reason for that is turnout.

As I show in the figure below, the turnout rates were uniformly high (above 80%) in nearly all of the 135/290 constituencies that Kenyatta won in 2013. Pro-Odinga constituencies had more spread, with the end result being that the candidate left a lot more votes on the table.

The same dynamics obtained at the county level (see above). In 2013 Odinga beat Kenyatta in 27 of the 47 counties. The counties that Odinga won had a total of 8,373,840 voters, compared to 5,977,056 in the 20 counties won by Kenyatta. The difference was turnout. The counties won by Odinga averaged a turnout rate of 83.3%. The comparable figure for counties won by Kenyatta was 89.7%. At the same time, where Kenyatta won, he won big — averaging 86% of the vote share. Odinga’s average vote share in the 27 counties was a mere 70%.

The same patterns may hold in 2017. The counties won by Odinga currently have 10,547,913 registered voters, compared to 7,556,609 in counties where Kenyatta prevailed. This means that Odinga still has a chance, but in order to win he will have to run up the numbers in his strongholds, while at the same time getting more of his voters to the polls. Given the 2017 registration numbers, and if the turnout and vote share patterns witnessed in 2013 were to hold this year, then Kenyatta would still win with 8,000,936 votes (51.5%) against Odinga’s 7,392,439 votes (47.6%).

The slim hypothetical margin should worry Kenyatta and his campaign team. For instance, with an 89% turnout rate and an average of 85% vote share in the 27 counties Odinga won, and holding Kenyatta’s performance constant, the NASA coalition could best Jubilee this August by garnering 8,921,050 votes (55.4%) vs 7,191,975 (44.6%).

Kenyatta is the favorite to win this August on account of incumbency and Jubilee’s turnout advantage. But it is also the case that the election will be close, and that even a small slip up — such as a 3 point swing away from Jubilee between now and August 8th — could result in an Odinga victory.

Is Asia Aging Prematurely?

This is from the FT:

China’s working-age population peaked in 2011 but its per capita income was just 20.7 per cent of the US level. Thailand was a little wealthier, at 28.9 per cent, when its working-age share peaked in 2013, but Vietnam was far poorer still, at 10.4 per cent of the US level, when it reached the same point a year later. Malaysia, Indonesia, India and the Philippines are projected to be somewhat better off when they reach peak working-age share, probably between 2020 and 2056, but still some way below the income levels reached in the west, as the third chart shows.

In February of this year, projections by Standard Chartered suggested that, by 2050, the likes of South Korea, Singapore, Thailand and China would have a higher share of pensioners in their population than most developed countries, depicted in the second chart [see below].

Screen Shot 2017-05-17 at 10.25.56 AM.png

These are pretty sobering figures. Basically (East) Asia’s dependency ratios will quickly begin to look a lot more like what obtains in low-income as opposed to high and upper middle income states. And that means a stagnation or even decline in per capita income.

It will be interesting to see how these countries — most of which have historically been averse to immigration — will deal with this demographic challenge.

In addition to the obvious economic challenges, Asian countries will also have to figure out how to take care of the medical needs of an aging population that will likely be living longer.

More on this here.

On Obsolescing Bargains: Hoima-Tanga Pipeline Edition

This is from the East African in March:

The incentive that among other things lured Uganda to choose the southern route is the tariff of $12.2 per barrel of oil that Uganda will pay to move its crude oil through Tanzania, which Ms Muloni says was “the best we got.”

pipeline

Source: Oil & Gas Journal

The East African has learnt that in a bid to hijack the deal from Kenya, which also discovered oil in the northern region, Tanzanian officials were willing to throw sweeteners into the deal, which included free land and a fair tariff.

But, after getting the deal, Tanzanian officials started raising doubts over the project’s benefits to Dar es Salaam, citing a number of issues, such as the fact that in Tanzania land belongs to the government, so Uganda did not have to compensate any landowners, hence an increase in the tariff to a figure that The East African could not establish, was seen as a fair deal for Dar.

I hope Ugandan negotiators are aware that Tanzania’s bargaining position will get even stronger after the 1445km pipeline is built.

On Uganda’s Textile Sector

This is from The Economist:

Uganda’s main advantages, for the moment, are cheap cotton and labour, and preferential access to American and European markets. When exporting to the rich world “Africa has an 18-35% duty advantage over any other continent”, says Nick Earlham, a shareholder in WUCC and in Fine Spinners. “It’s very competitive.”Screen Shot 2017-05-04 at 1.13.26 PM

Textile workers in Kampala earn about $85 a month, compared with $150 in Kenya and $108 in Vietnam, never mind up to $700 in China. But these savings are offset by problems in almost every other sphere. Power cuts keep plunging the factory into darkness, and an erratic supply of steam to the dyeing machines makes it hard to ensure that each batch of fabric looks alike.

Textiles appear to be a low hanging fruit as far as creating mass employment in African states is concerned. And, at least for now, they will remain immune from the threat of mechanization:

Robots are not yet much good at fiddly sewing jobs on floppy fabric; less than 0.1% of the world’s industrial robots are in the clothing trade.

More on this here.

Lastly, while production levels have not increased significantly over the last decade, FAO data (see below) do suggest a non-trivial increase in productivity (yield/ha) in Uganda’s cotton sector. This outcome could be a result of a myriad causes, but it is in line with recent research by Bates and Block (2013) showing increased agricultural productivity in African states that experienced real exposure to competitive electoral politics.

Screen Shot 2017-05-04 at 1.50.16 PM.png

Is Civil War in Africa Unique?

Paul Staniland raises important questions in his review of Philip Roessler’s latest book (highly recommended):

I just finished reading Philip Roessler’s excellent book for my graduate Civil War seminar. Already a fan of his 2005 piece on electoral violence, I learned a lot from the new book and highly recommend it. But, just as when reading major work by Will Reno, Reno and Chris Day, Jeremy Weinstein, Paul Collier, Jeffrey Herbst, and others, I had the reaction that “This looks nothing like the places I study.” At least in the stylized world of African politics presented in these projects (I have no idea if this is accurate), Hobbesian insecurity preys on all in the absence of any real institutions, ethnic balancing and calculation dominates any other form of politics, and regimes are held in place by fluid, shifting alignments with “Big Men” rooted in local power bases.

As a result, we get shambolic and weak central regimes prone to either coups or revolts, and rebels easily bought off by patronage or co-optation. Weinstein highlights the inability of ideological rebels to overcome waves of material resources that eliminate discipline or politics, Roessler’s regimes are simply what Skocpol calls an “arena” for political competition between social actors rather than possessing any institutions or interests autonomous from social forces, and Reno’s civil wars (with the exception of “reform rebels”) are simply a grim game of bargaining over patronage between states and insurgents that are more similar than different.

Is Africa that different?

Roessler, indeed, argues that Africa has a “unique institutional structure” in which external conflicts are rare and internal disorder common. If Africa is indeed unique, it is hard to know how arguments rooted in the African context can travel beyond Africa.

Read the whole thing here.

I would argue that there is not a uniquely African civil war story. Weak states everywhere, including in Africa, are gonna weak state.

A more useful analytical delineation is what Staniland suggests:

At minimum, I’m becoming increasingly convinced that research on civil war needs to become at least partially bifurcated into work on its dynamics in very weak states (the representation of African conflicts dominant in the literature, plus Afghanistan and a few others) versus those in medium-capacity states (India, Colombia, Indonesia, Russia, etc) that possess large, centrally controlled conventional an

Think of the Nigerian Civil War between 1967-1970. The Biafra War involved a relatively strong state facing a relatively well-organized and disciplined secessionist army — much in the mold of middle income conflicts. In the same vein, countries like Kenya and Ethiopia have managed to quell rebellions in Mt. Elgon & the south coast, and in the Ogaden, respectively, in ways that would look very familiar to Staniland.

Completely anarchic conflicts involving collapsing states and incoherent hyper-localized rebellions — your stereotypical African conflict, if you will — are a unique historical experience rooted in the states that did really fall apart in the late 1980s to early 1990s (pretty much in the midst of Africa’s continental economic nadir). It is instructive that these states were concentrated in the Mano River region and Central Africa, some of the regions worst affected by the socio-political challenges of Africa’s lost long decade (1980-1995). income

And given recent economic trends in Africa (see image), it is not surprising that conflicts are becoming rarer in Africa (much in line with Fearon and Laitin). I would also expect markedly different kinds of conflicts should they emerge. There is a reason Boko Haram has never posed an existential threat to the Nigerian state, very much in the same way that India’s Maoist rebels are a peripheral matter.

I always remind my students that the Africa they know is more often than not the Africa that existed between 1980 and 1995. We all need to update.