Below is an amazing illustration of shifts in the sizes of leading global economies:
Wold GDP by Country pic.twitter.com/MqYJuyehAP
— Michael (@mnicoletos) November 1, 2018
For more on China see here, here, here, and here. This reminded me of this graphic from Carlos Lopes, former head of the UNECA: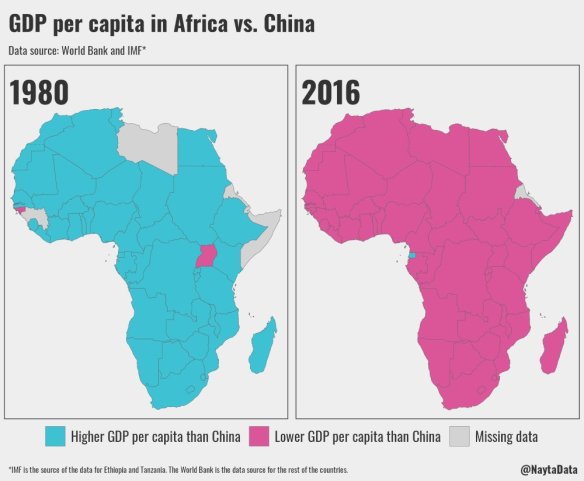
All that happened in just 36 years. Time is on Africa’s side. If (and that’s a big IFF) African elites can get their act together. As shown in the graph below, the lost long decade (1980-1995) was particularly brutal for African economies — but it was a temporal dip and not a permanent feature of African economies.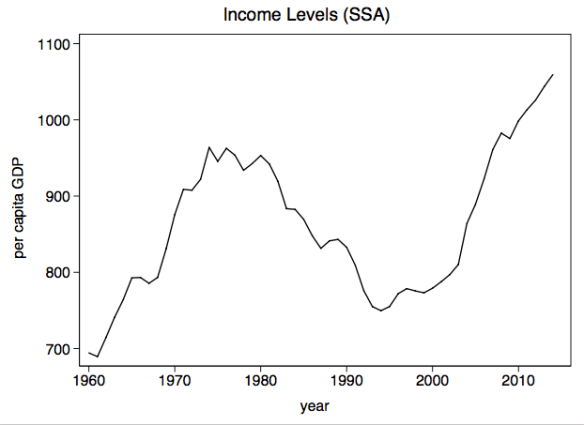
It is also worth noting that in 1980 African states and China were not at the same level of institutional development. By that time China had already accumulated centuries of coherent stateness — which made it possible for elites to optimally allocate human and capital resources in ways that produced the growth miracle.
Here is a good nuanced take on trends in economic growth and development on the Continent.
