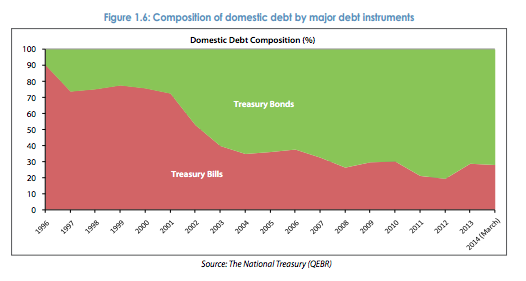
Over the last two decades there has been a remarkable shift in the composition of domestic government debt in Kenya, with long-term debt instruments (bonds) increasingly preferred to short-term debt (T-Bills).
The financial market in Nairobi is telling us a thing or two about creditors’ perceived time horizon of the Kenyan government; and Treasury’s capacity for credible commitment.
Source: The World Bank
For curious readers, I would argue that the explanation for this structural change (especially after 2003) is more Stasavage than North and Weingast.

Could one argue that this also reflects a strong demand for long-term KES-denominated investments in a market where there’s a dearth of such securities, which then coincides with the government’s desire for long-term obligations which don’t require frequent rollovers? I’d also be interested to see the term structure of the government’s liabilities; I’d be concerned if long-term borrowing were being used predominantly to finance short-term obligations.
LikeLike
Investors seem to perceive longterm macroeconomic & political stability in Kenya; abit strange as the risk of insurgency seems not to have been priced in or totally discounted as transitory
LikeLike