Max Roser has some interesting graphs on child mortality here.
He also makes an interesting observation on the fluctuations in mortality rates in the 19th century:
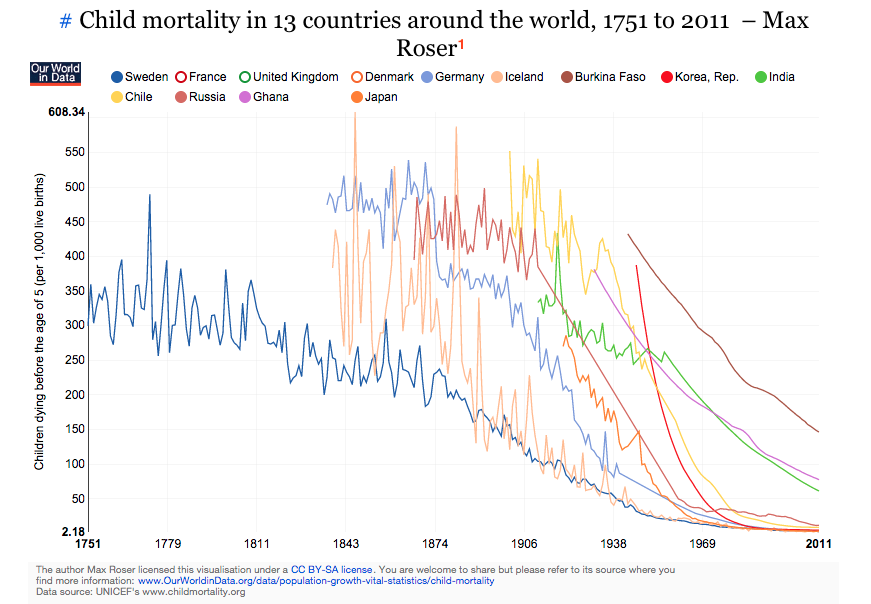
A second interesting characteristic that is immediately noticeable is that the series are very ‘spikey’ in the 19th century and are then much smoother in the 20th century. This is partly because the data quality is improving over time but it also shows how frequent crises were in pre-modern times. The decline of crises is an important aspect of improving ‘living standards’. In the ‘Our World in Data’ entry on food price volatility you find a long-run series of food price volatility in Pisa by Cormac O Grada that shows how frequent food crises were.
This is an important observation. One of the key differences between wealthy and relatively poorer countries is the variance in their growth rates. Most advanced economies grow (and have historically grown) at a steady rate (Tyler Cowen for example notes that Denmark never had a “growth miracle”). Developing countries on the other hand experience relatively greater levels of both longitudinal and cross-sectional variation in growth rates. The boom-burst cycles often make it hard for meaningful accumulation of wealth and steady growth of per capita income.
